System Tab — Diagnostics & Tools
The System tab is the operator's debugging surface. Open it any time a metric on the Dashboard tab looks wrong, a Sonarr indexer test fails, or the dashboard responds with a non-200 you can't explain. Four sub-tabs: Health Check, Torznab Test, GraphQL Explorer, Raw Metrics.
When to open the System tab
A short triage table:
| Symptom | First sub-tab to open |
|---|---|
Dashboard stat cards stuck at 0 / -- |
Health Check → Connectivity Test |
| Sonarr/Radarr indexer test fails | Torznab Test |
| GraphQL queries hanging or 500ing | GraphQL Explorer |
| Grafana dashboards show wrong/missing series | Raw Metrics |
[Errno 111] Connection refused in dashboard logs |
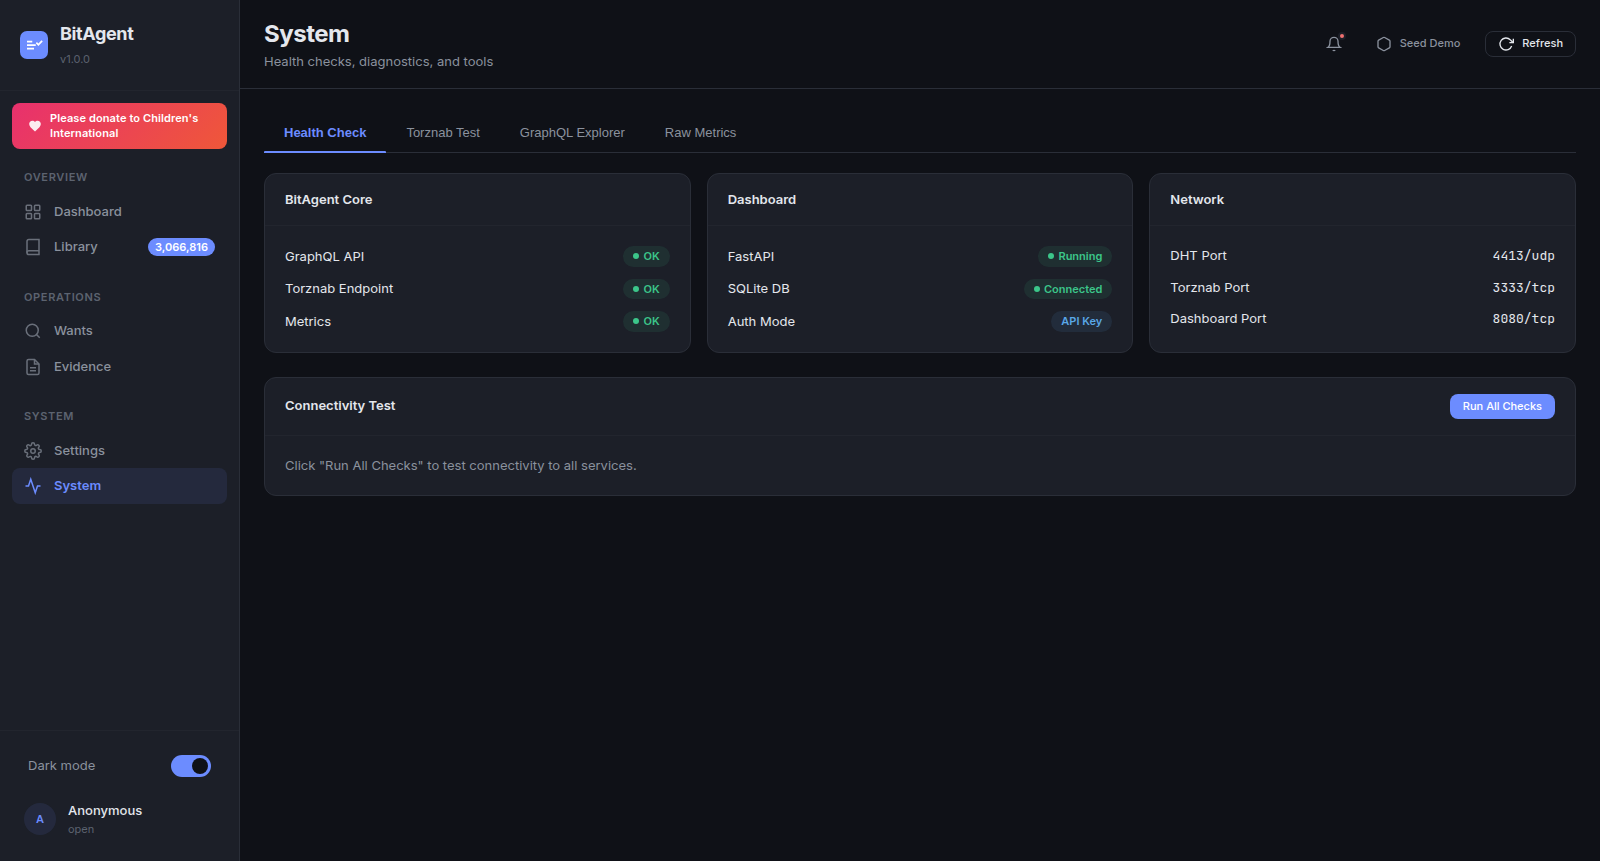
Health Check (BitAgent Core card) |
Health Check walkthrough
Health Check is three side-by-side cards, each verifying one subsystem.
BitAgent Core card. One row per upstream endpoint:
- GraphQL API —
OKwhen${BITAGENT_GRAPHQL_URL}returns a valid GraphQL envelope on a probe query. Degraded states:connection refused(core not running),timeout(core overloaded),404 not found(URL wrong),500 internal server error(core has a bug — open the core's container logs). - Torznab Endpoint —
OKwhen the configured Torznab base returns the caps XML on?t=caps. The same failure modes as above, plus401ifTORZNAB_API_KEYis set on the core but the dashboard isn't sending it. - Metrics —
OKwhen${BITAGENT_METRICS_URL}returns Prometheus exposition format withbitagent_*series.OKhere is required for the Dashboard tab's stat cards to populate.
Dashboard card.
- FastAPI —
Running. (Hard to fail; if you can see the page, FastAPI is running.) - SQLite DB —
Connectedwhen the/data/bitagent-ui.dbfile is readable + writable. Common failure: the volume mount has the wrong permissions; the dashboard's container user can't write. - Auth Mode — the active resolution method on the current request:
Open(whenREQUIRE_AUTH=false),API Key,NPM,Forwarded-User, orSSO.
Network card. Bound port readouts (read directly from the bound socket, not from config — so a config drift is visible here):
- DHT Port —
4413/udp. The crawler's BEP-5 listen port. - Torznab Port —
3333/tcp. The core's HTTP port (also serves GraphQL + metrics). - Dashboard Port —
8080/tcp(or the value ofAPP_PORT). The FastAPI bind.
A -- value on any row indicates the socket isn't bound — usually a startup failure; check container logs.
Connectivity Test
The Run All Checks button runs every Health Check probe synchronously and reports a per-check latency. Use it after:
- Firewall changes.
- VPN provider switches on the bitagent core (e.g. NordVPN → AirVPN).
- Container recreations where you've changed env vars.
- Adding a reverse proxy / SSO gateway in front of the dashboard.
Latency expectations: GraphQL and Metrics probes should be sub-50ms on localhost / private LAN, sub-200ms across continents. Over 1s on any check usually means a timeout retry rather than slow latency — check the core's load.
Torznab Test recipes
Use the Torznab Test sub-tab when *arr says "0 results" or "test failed" but you suspect the issue is on the *arr side. The sub-tab takes a query string and submits it against the configured BitAgent core.
TV episode search
?t=tvsearch&q=breaking+bad+s05e16&apikey=<TORZNAB_API_KEY>
Should return XML with <item> blocks for any matching releases.
Movie by IMDb ID
?t=movie&imdbid=tt0944947&apikey=<TORZNAB_API_KEY>
Note imdbid is the bare IMDb identifier without the tt prefix in some *arrs — Torznab itself accepts both. If you get zero results with tt0944947 and the title-search returns hits, drop the tt.
Music by artist + album
?t=music&artist=Pink+Floyd&album=Animals&apikey=<TORZNAB_API_KEY>
If you get zero results: BitAgent's caps endpoint must declare music-search for Lidarr to call this category. Confirm the core has classified at least one music torrent — otherwise caps suppresses the music category and Lidarr never sends the query.
GraphQL Explorer recipes
The Explorer is a minimalist text-area + Run button — not GraphiQL. No autocomplete, no schema browser. Use it to verify schema after a core upgrade.
List the most recent 10 torrents
query {
  torrentContent {
    search(input: { queryString: "", limit: 10 }) {
      items {
        infoHash
        title
        contentType
        seeders
      }
    }
  }
}
Classifier recent decisions
query {
  classifier {
    recentDecisions(limit: 10) {
      infoHash
      verdict
      score
      reason
    }
  }
}
(Schema availability depends on core version — check via introspection if the field is missing.)
Raw Metrics
The Raw Metrics sub-tab streams /metrics in Prometheus exposition format. Use this to verify that the metric names your Grafana dashboards expect actually exist on this version of the core. Most useful counters:
bitagent_dht_peers_total— current DHT routing table size. Should be in the hundreds within minutes of bootstrap, low thousands after a few hours.bitagent_torrents_indexed_total— cumulative count of admitted torrents. Monotonic; rate of change is the indexing throughput.bitagent_classifier_decisions_total{verdict="..."}— cumulative classifier decisions by verdict (admit,reject,defer). The reject:admit ratio is a useful spam pressure indicator.bitagent_torznab_requests_total{category="..."}— cumulative Torznab queries from*arr. If this is zero, your*arrisn't actually polling.bitagent_csam_blocklist_export_total{outcome="..."}— outcome of the post-classify CSAM defense hook (blocked,skipped_no_match).
For Grafana scraping, point the Prometheus job at the same URL the dashboard reads — ${BITAGENT_METRICS_URL} — not at the dashboard. The dashboard is a consumer, not a producer.