Dashboard UI Guide
Overview
The BitAgent v1.0.0 dashboard is the operator surface for the DHT crawler — live metrics, indexed catalogue, operator-defined search targets, *arr feedback, runtime configuration, and diagnostics, all in a single page. It is read-mostly: heavy mutations (settings overrides, want CRUD) are persisted to a local SQLite sidecar; everything else streams from the BitAgent core's GraphQL and Prometheus endpoints.
Use the dashboard for: confirming the crawler is healthy, telling BitAgent what content you actually want via Wants, verifying that *arr import webhooks are reaching the evidence pipeline, and troubleshooting connectivity from the System tab. The dashboard never bypasses the core — every change you make is via documented endpoints, so anything you can do here you can also script with curl.
Layout
The interface is a left sidebar + top header bar + scrollable main content area. The sidebar is grouped:
- OVERVIEW — Dashboard, Library
- OPERATIONS — Wants, Evidence
- SYSTEM — Settings, System
The sidebar footer carries a Dark mode toggle (persists to localStorage) and a user avatar that renders the first letter of the authenticated display name with the auth method label below it. The wordmark in the top-left shows BitAgent and v1.0.0.
The header strip carries three controls in the top-right:
- Notifications bell — recent webhook delivery failures and crawler warnings.
- Seed Demo — POST to
/api/seed-demo, populates wants / evidence / notifications with deterministic sample rows. Idempotent. Useful for screenshots and demos. - Refresh — re-fetches the data for the visible tab only.
Dashboard tab
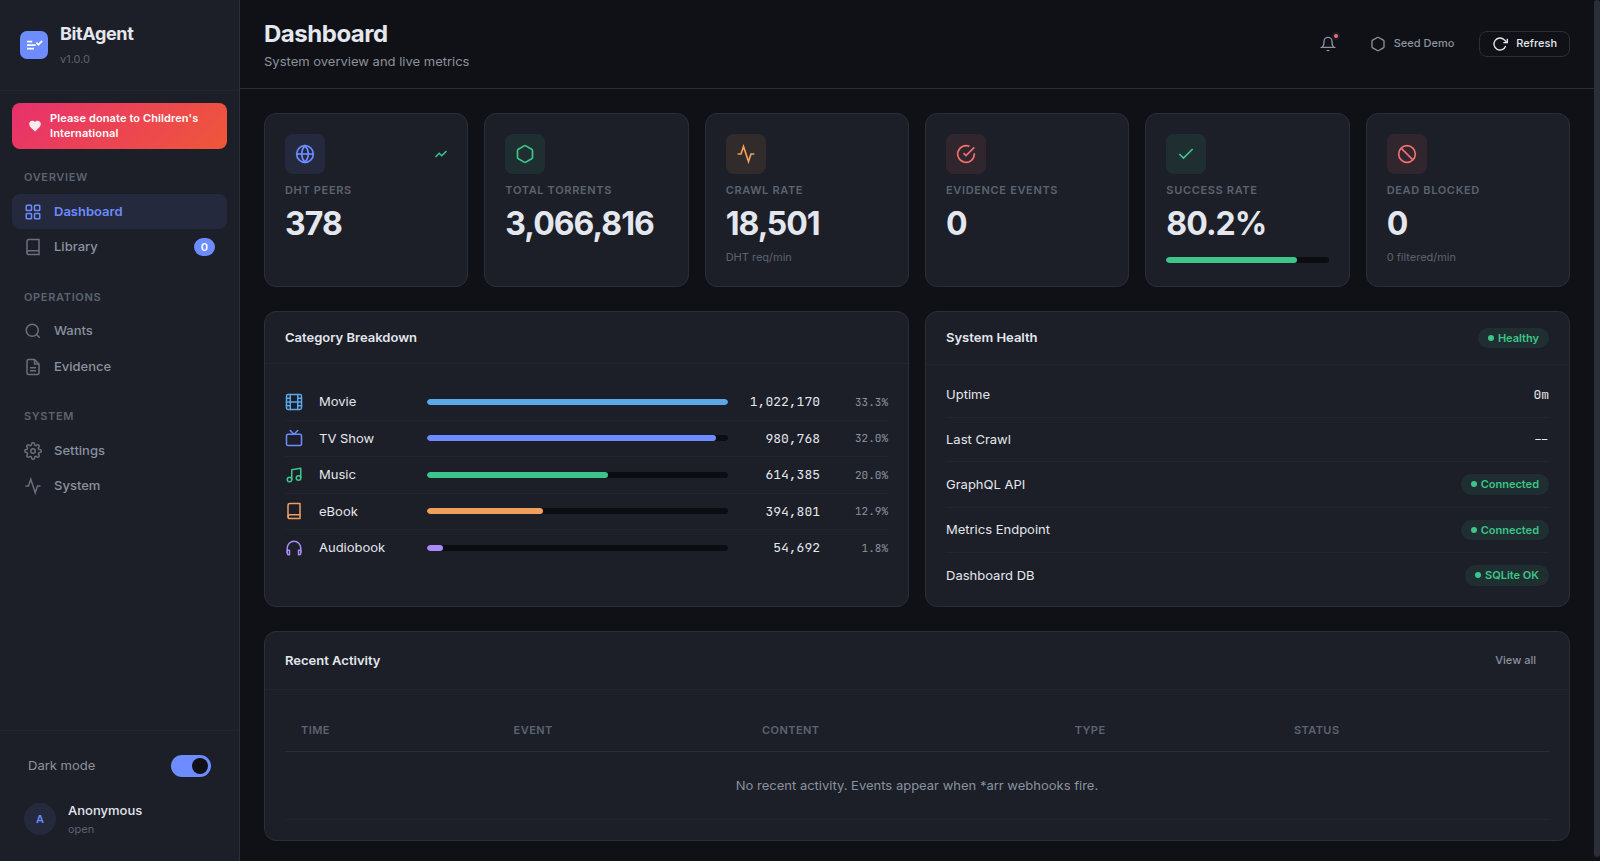
The Dashboard tab is the at-a-glance health view.
The top row is six stat cards: DHT PEERS, TOTAL TORRENTS, RELEASES, EVIDENCE EVENTS, THROUGHPUT (torrents/min), CACHE HIT RATIO. Values update on each refresh tick (default 10s when not connected to SSE).
Below the stat cards, two side-by-side panels:
- Category Breakdown — share of the indexed catalogue by media type. Empty placeholder until the core has classified any content: "Connect to BitAgent core to see category data."
- System Health — a green Healthy badge plus rows for Uptime, Last Crawl timestamp, GraphQL API status, Metrics Endpoint status, Dashboard DB (
SQLite OK/SQLite ERROR).
A Recent Activity table at the bottom (TIME / EVENT / CONTENT / TYPE / STATUS) shows the most recent 20 evidence events. "View all" in its top-right takes you to the Evidence tab. Empty state: "No recent activity. Events appear when arr webhooks fire."*
Library tab
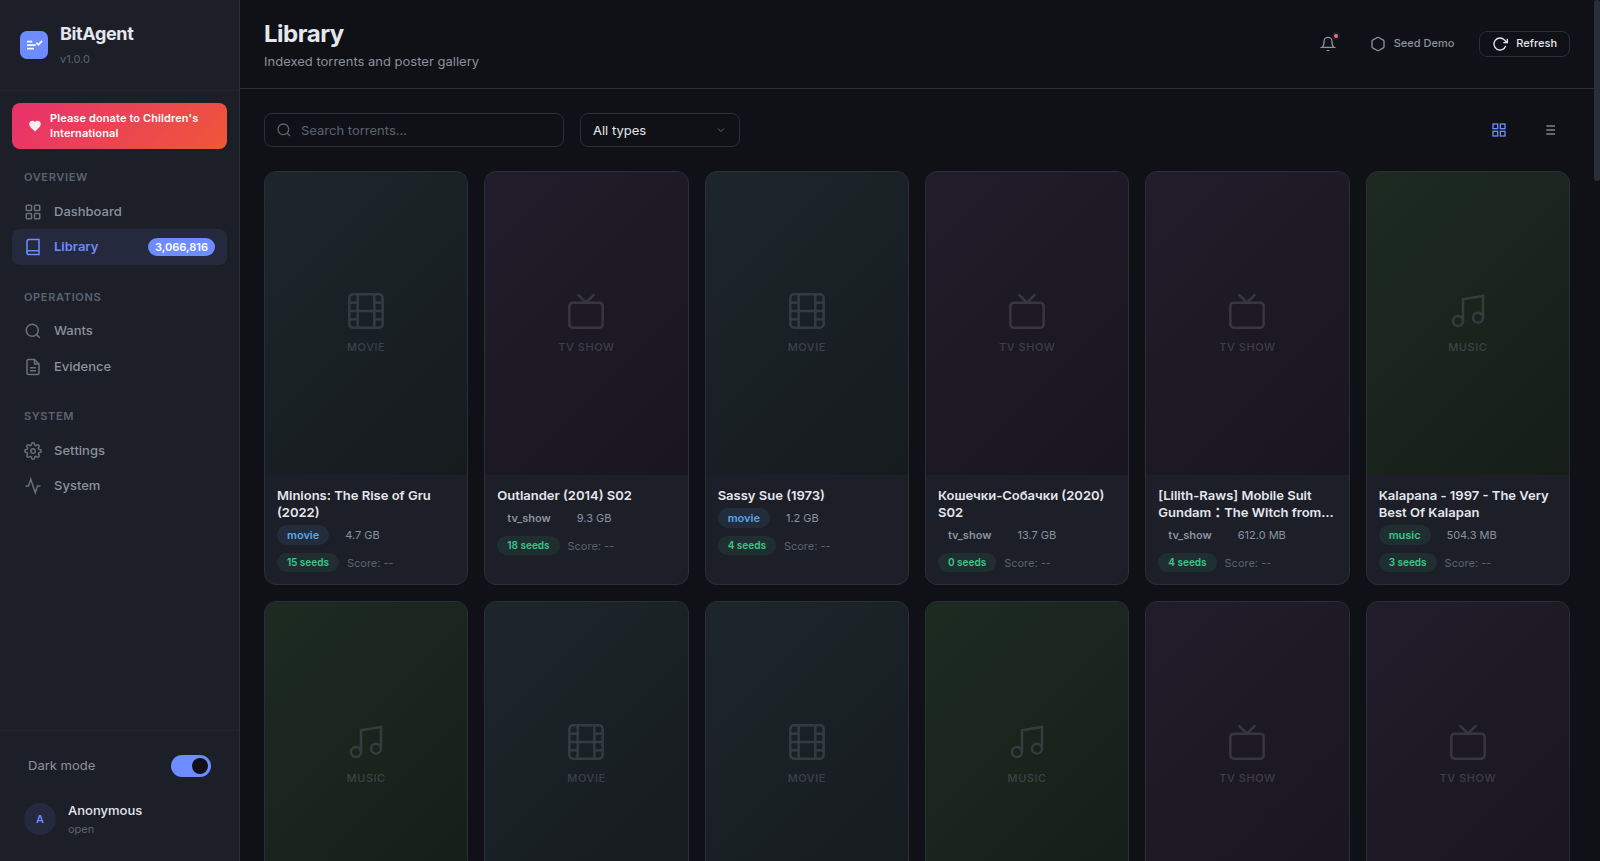
The Library is the indexed catalogue — every torrent the BitAgent core has classified and admitted. Search is text-only (free text matches title / infohash / category tags). The All types dropdown filters by classifier verdict (movie, tv_show, music, ebook). The grid/list view toggle in the top-right switches between a poster gallery (TMDB-fetched art when TMDB_API_KEY is set, text fallback otherwise) and a denser table.
Pagination is Previous / Next with a "Showing X–Y of Z" footer. The page size is fixed at 50.
Empty state: "No torrents found. Adjust your search or wait for the DHT crawler to index content."
When the BitAgent core has classified content, every row resolves to a TorrentContent GraphQL object. Clicking a row reveals the infohash beneath the title — useful for magnet:?xt=urn:btih: links.
Wants tab
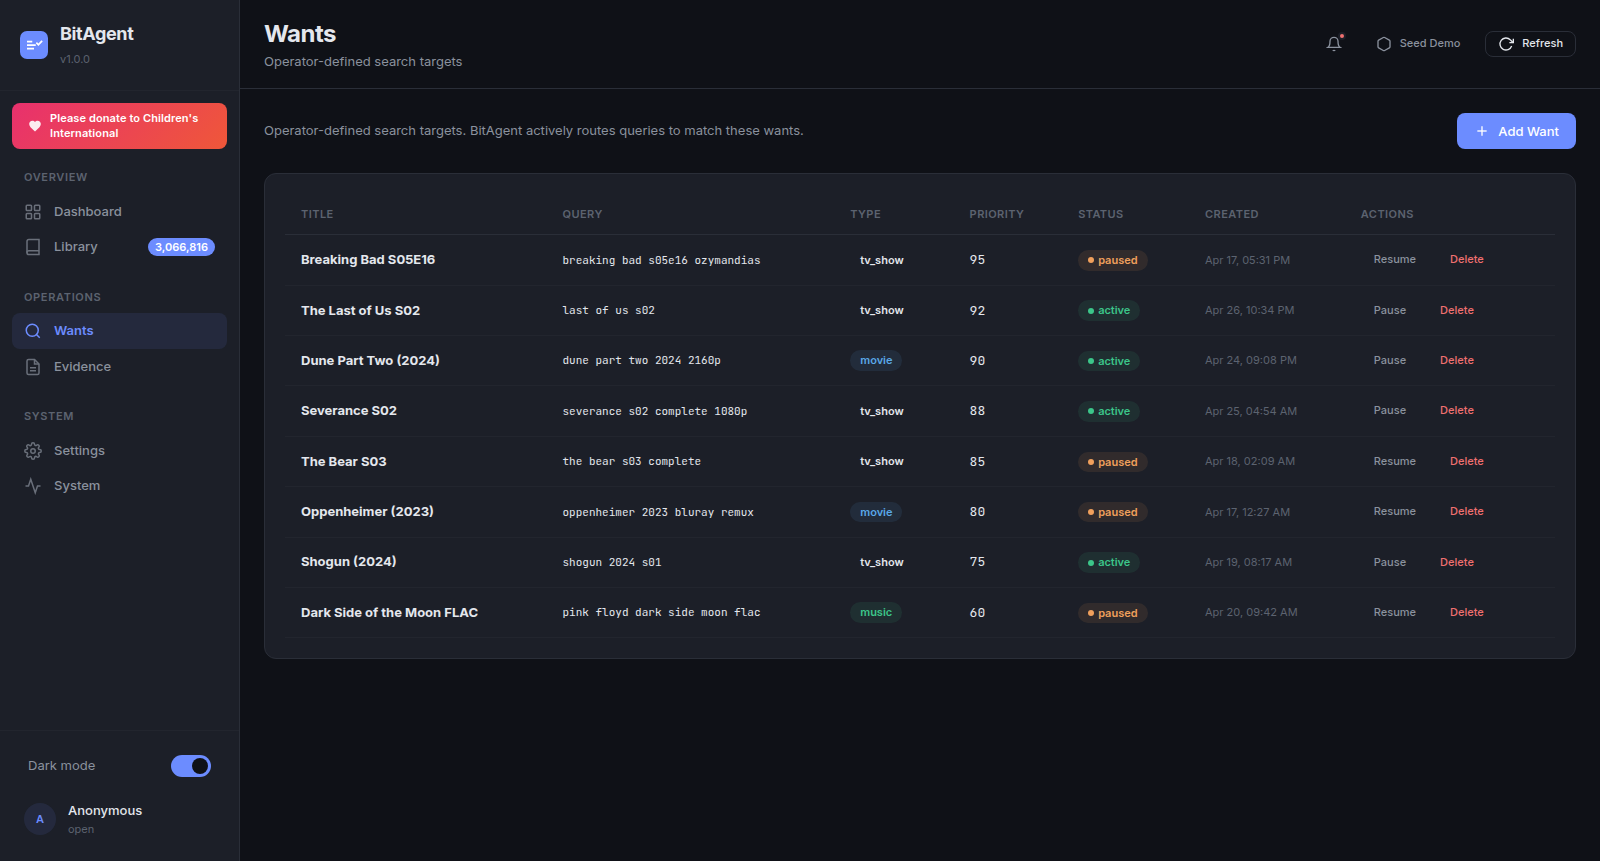
Wants are the operator's voice in the indexer. Each want is a persistent search target (title, query string, type, priority 0–100, status). The classifier biases admission toward content that matches an active want — the same way a *arr quality profile biases its grabs.
Columns: TITLE, QUERY, TYPE (movie / tv_show / music / ebook badge), PRIORITY (integer 0-100, higher first), STATUS (active / paused), CREATED, ACTIONS (Pause/Resume + Delete).
Use Add Want in the top-right to create one — the modal exposes Title, Query (free-text, case-insensitive), Type dropdown, Priority slider (default 50). Pause keeps the row + history; Delete is permanent. See Wants Guide for the API and priority semantics.
Evidence tab
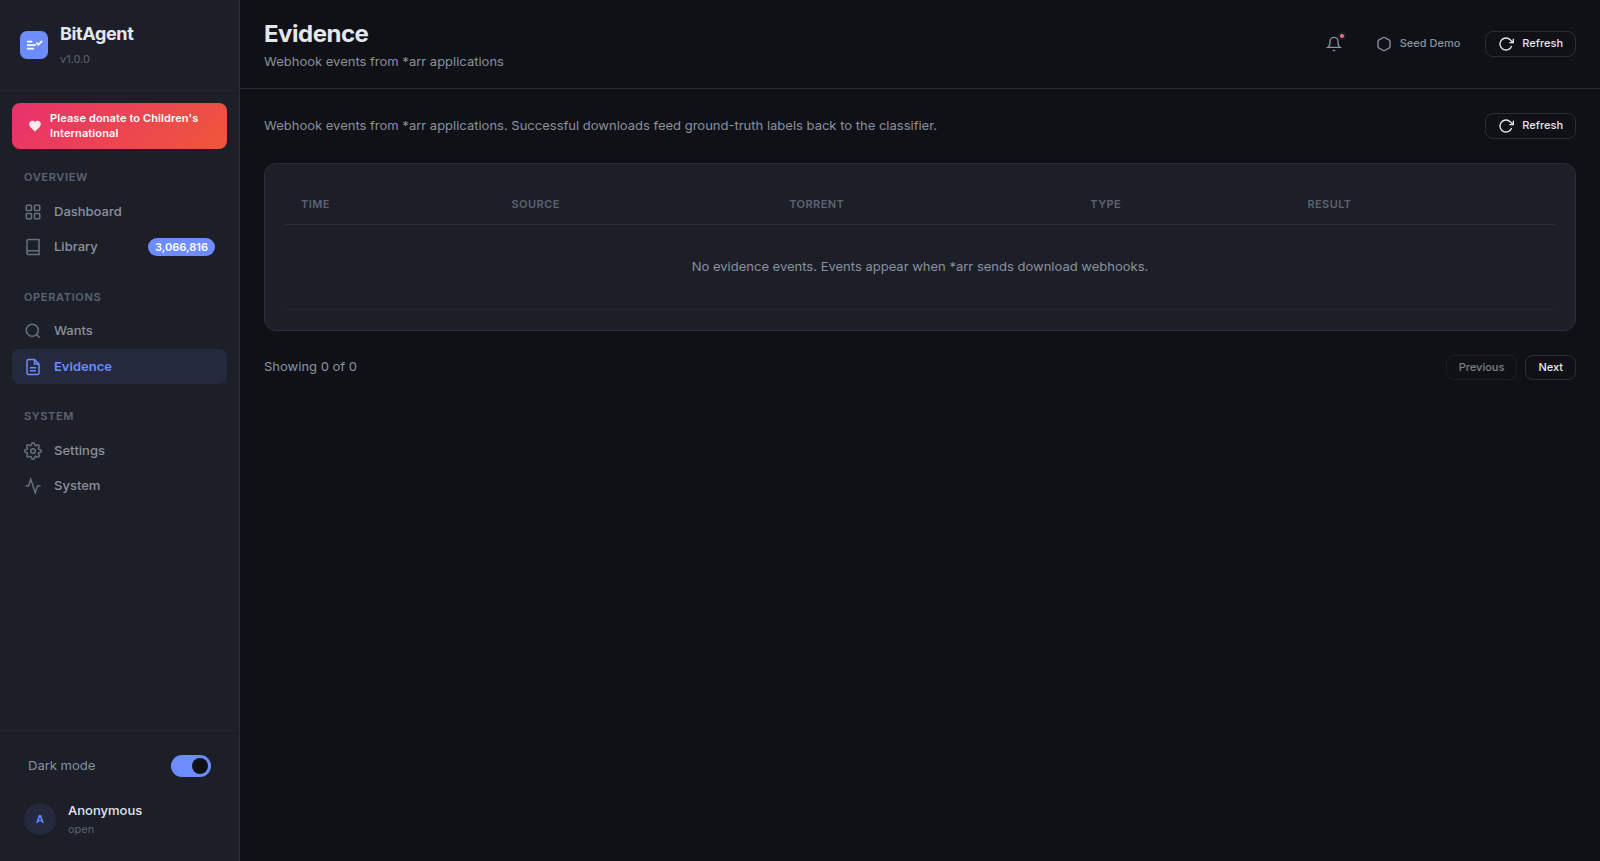
The Evidence tab is the read-only view of incoming *arr webhook events. Each row is one POST from Sonarr / Radarr / Lidarr / Readarr to /api/evidence. Columns: TIME, SOURCE (sonarr / radarr / lidarr badge), TORRENT, TYPE (grab / download / import), RESULT (success / failed / duplicate).
Empty state: "No evidence events. Events appear when arr sends download webhooks."*
This is the closed-loop feedback signal that distinguishes BitAgent from naïve Torznab providers — every successful import is a ground-truth label that flows back into classifier weights. See Evidence Pipeline for the full diagram and the *arr webhook configuration steps.
Settings tab
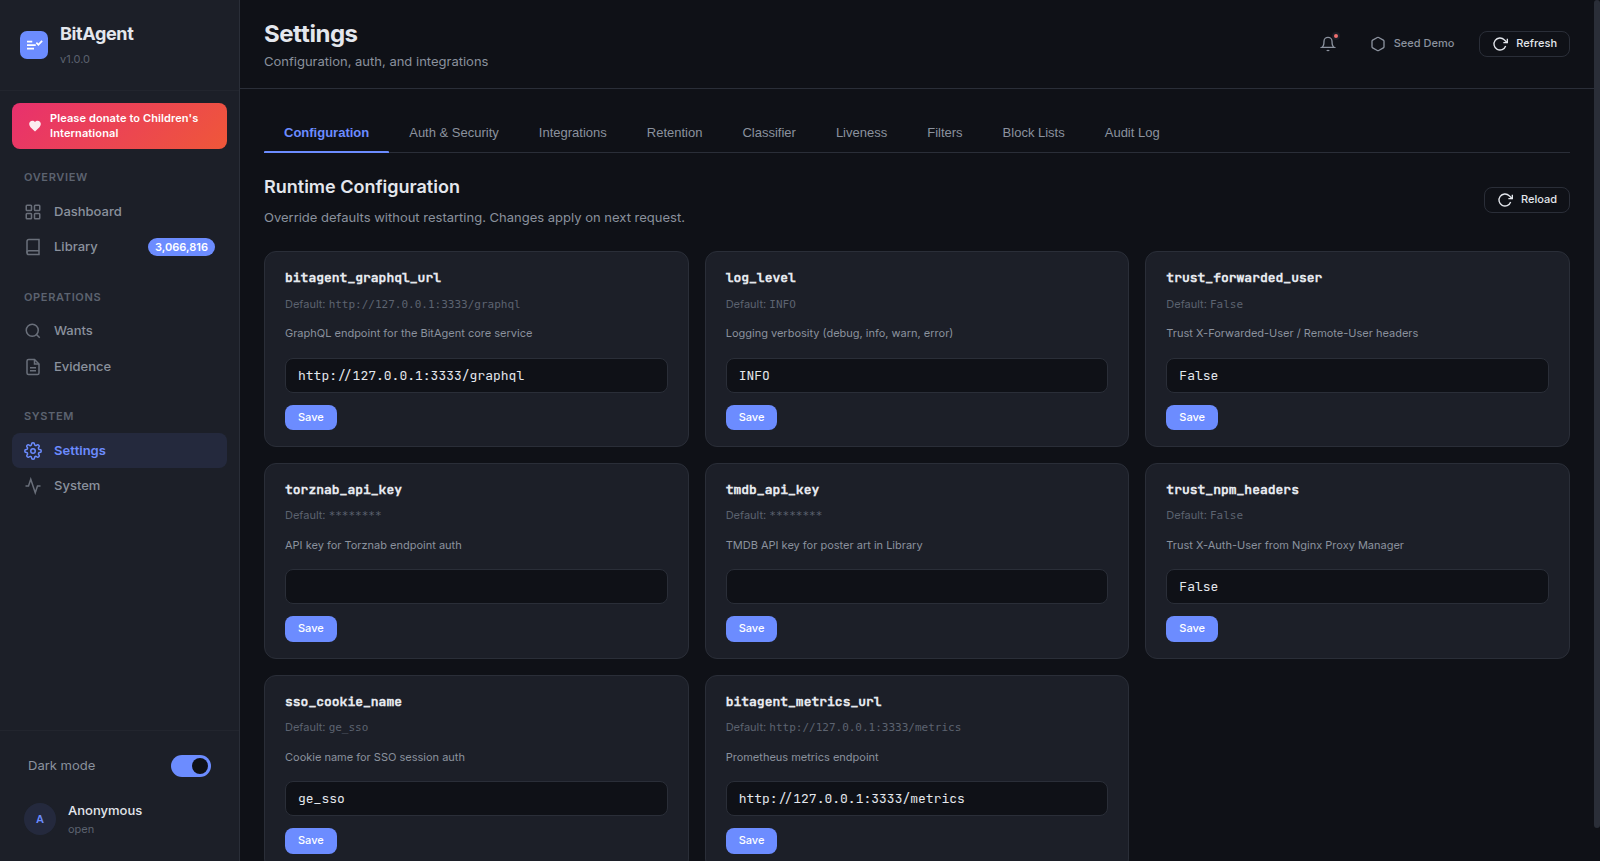
Settings is the runtime configuration surface. Six sub-tabs:
- Configuration — the mutable runtime knobs (image above). One card per field:
torznab_api_key,bitagent_metrics_url,sso_cookie_name,tmdb_api_key,bitagent_graphql_url,trust_npm_headers,trust_forwarded_user,log_level. Each card shows the current value, theDefaultline, a freeform input, and a Save button. Saved overrides apply on the next request — no restart. - Auth & Security — toggle
REQUIRE_AUTH, set/rotateDASHBOARD_API_KEY, configure SSO cookie name + lifetime. - Integrations — Torznab base URL, TMDB API key, optional metric scrape targets.
- Retention — DHT routing-table TTL, evidence log retention, poster cache eviction interval.
- Classifier — heuristic weights, regex normalizers, NSFW filter strictness.
- Audit Log — append-only history of override changes, auth events, and health-state transitions. Read-only.
All cards on the Configuration sub-tab are backed by the MUTABLE_FIELDS allowlist in config.py — fields outside the allowlist (e.g. host, port, db_path) are not exposed here on purpose; they require a container restart to change.
System tab
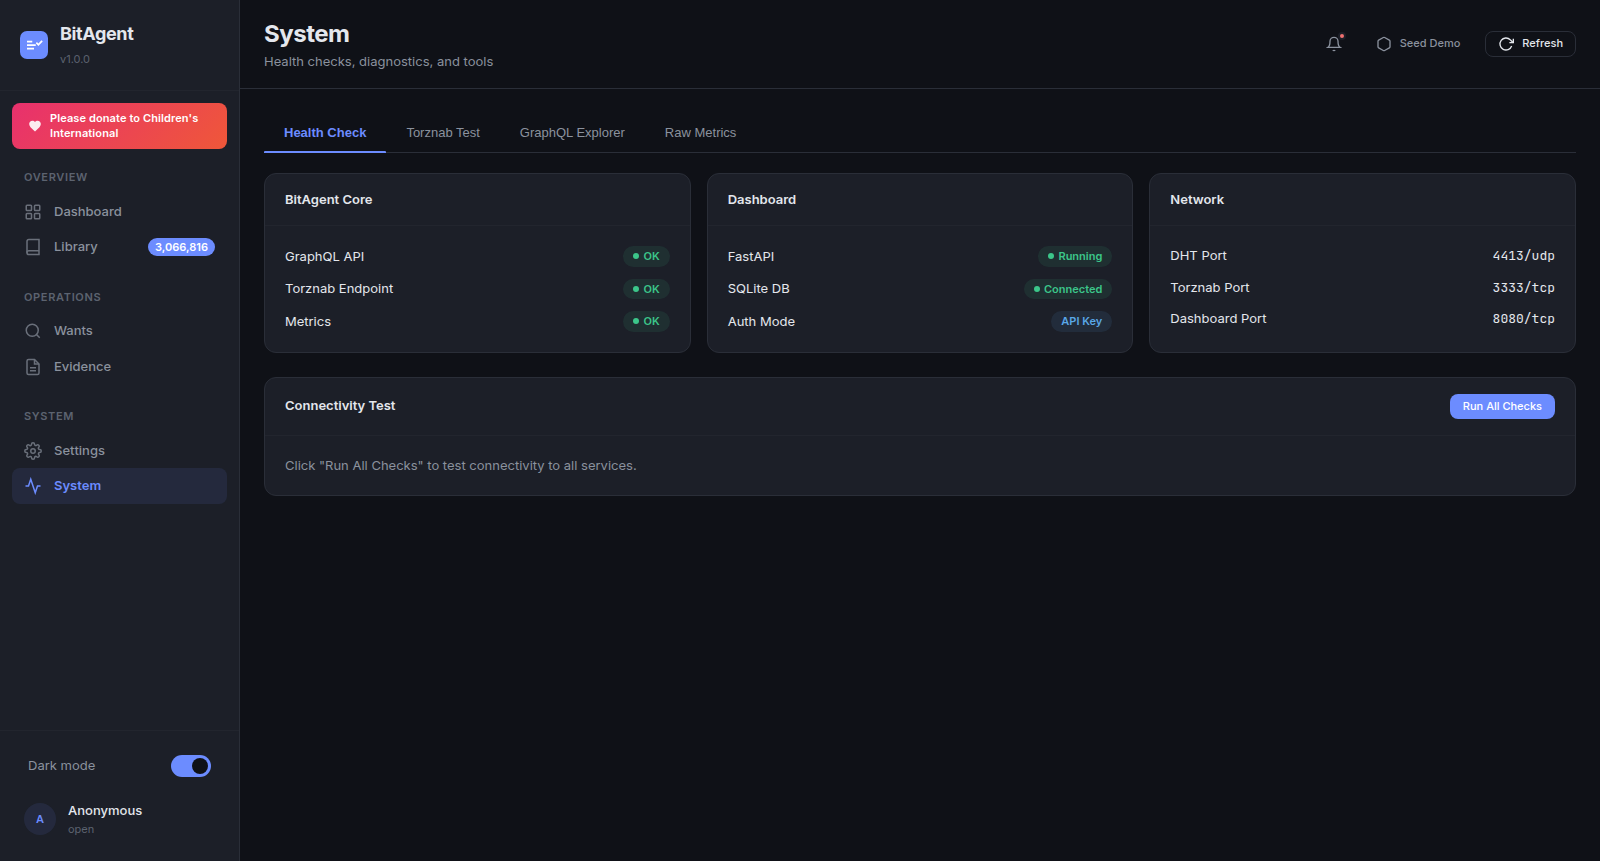
System is the diagnostics surface — open it any time the Dashboard tab looks wrong, or a Sonarr indexer test fails. Four sub-tabs:
- Health Check — three cards (BitAgent Core / Dashboard / Network) each with one-line status rows. The Connectivity Test panel underneath has a Run All Checks button that probes every endpoint synchronously and reports per-check latency.
- Torznab Test — submit a manual Torznab query (e.g.
?t=tvsearch&q=...&apikey=...) against the configured BitAgent core. Useful when *arr says "0 results" but you suspect a filter / key issue. - GraphQL Explorer — minimalist text-area + "Run" button. Not GraphiQL — no autocomplete, no schema browser. Use it to confirm the schema after a core upgrade.
- Raw Metrics — streams
/metrics(Prometheus exposition format). Verify the metric names match what your Grafana dashboards expect.
Network card values are read directly from the bound sockets, not from config — so a mismatch between configured port and actual bound port is visible here.
See System Tab — Diagnostics & Tools for sub-tab walkthroughs and ready-to-paste Torznab + GraphQL recipes.
Authentication
The dashboard supports four auth tiers, all gated by REQUIRE_AUTH=true. With REQUIRE_AUTH=false (default), every endpoint is open — fine for a private-network-only deployment, never safe on the public internet.
When enforced, identity is resolved in this order:
- HMAC API key — passed as
?apikey=,Authorization: Bearer <key>, orX-API-Key: <key>. Compared withhmac.compare_digestagainstDASHBOARD_API_KEY. - NPM
x-auth-userheader — whenTRUST_NPM_HEADERS=true, the dashboard trusts the username injected by Nginx Proxy Manager's auth subrequest. X-Forwarded-Userreverse-proxy header — whenTRUST_FORWARDED_USER=true, the dashboard trusts the username injected by Authelia, oauth2-proxy, Cloudflare Access, or any standard reverse proxy.- SSO cookie — when an HS256-signed JWT is present in the cookie named by
SSO_COOKIE_NAME, the dashboard validates it and uses thesubclaim as the identity.
Failures fall through to the next tier; if none match, the request gets 401 Unauthorized. The current resolution method is shown on the System → Health Check card and on the sidebar avatar's secondary line.
Theming and accessibility
The dashboard ships dark by default. The Dark mode toggle in the sidebar footer flips the data-theme attribute on <html> and persists the preference to localStorage under bitagent-ui:theme. The toggle takes effect instantly — no page reload.
prefers-reduced-motion is honoured: pulse animations on the stream-pill and sidebar transitions are suppressed when the OS reports motion sensitivity.
Keyboard navigation is partial in v1.0.0: Tab / Shift+Tab cycles primary controls and the Add Want / Save buttons are reachable, but full ←/→ tab navigation across the sidebar is on the v1.1.0 roadmap.
Seeding demo data
Click Seed Demo in the header to populate wants, evidence, and notifications with deterministic sample rows. The endpoint (POST /api/seed-demo) is idempotent — it dedupes on (title, query) for wants and on (infohash, type) for evidence, so repeated clicks don't duplicate. Use this when:
- Generating screenshots for documentation (this exact UI was screenshotted with seeded data).
- Smoke-testing webhook parsing without a live
*arr. - Demoing the dashboard before the DHT has finished bootstrapping.
The seeded rows persist in bitagent_ui_data (the named volume mounted at /data) until you delete them by hand or destroy the volume.